Last week, in a post that prompted a reader to complain that I haven’t mastered English, I sought to explain why we should be skeptical of claims about the effects of programs when those effects are expressed in terms of months or years of learning. The point of reference was the DC Opportunity Scholarship Program, a controversial federally-funded program providing vouchers worth up to $7,500 for children in the DC Public Schools to attend private schools. Characteristic of the reporting was the Wall Street Journal‘s claim that “Children attending private schools with the aid of the scholarships are reading nearly a half-grade ahead of their peers who did not receive vouchers.”
I expressed concern that the quantity “a half-grade ahead” is a function of how sensitive a test is to changes over time in performance; a given effect will look bigger if the amount of growth on the test from one year to the next is small than if the amount of annual growth is large.
Today I want to demonstrate another oddity that follows from using this approach. Before we begin, think about this question: What percentage of fourth-graders in a state or district do you think are performing at the level of the average seventh-grader in that state or district? Put differently, what percentage of fourth-graders do you think are performing three years above grade level?
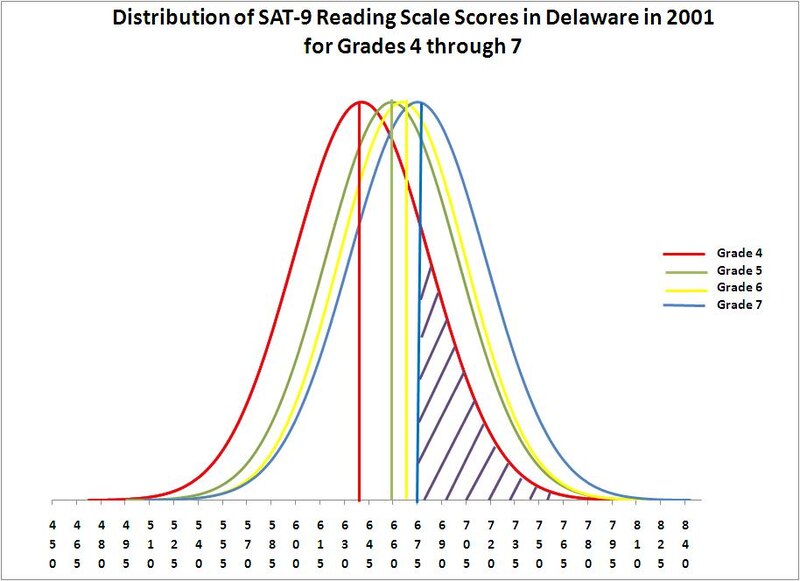
I’m betting that you have a pretty small number in mind. If so, what follows may surprise you. The figure below shows the distribution of scores on the SAT-9 reading test administered in the state of Delaware in 2001. The bell-shaped curves represent the distribution of scale scores on the test for grades 4 through 7, with the red curve as grade 4, the green curve as grade 5, the yellow curve as grade 6, and the blue curve as grade 7. (The curves are normal curves based on the mean and standard deviation for each grade, and thus are hypothetical distributions, not actual score distributions.) You can see that there is a lot of overlap in the distributions, although the mean scale score is higher each successive grade—641, 659, 665 and 675, respectively. The amount of spread or dispersion in scores within a given grade is much larger than the gains in scores from grade to grade. The average gain from fourth grade to seventh grade is 675 – 641 = 34 points, which is less than one standard deviation of the fourth-grade distribution (i.e., 42 points).

The figure allows us to see what percentage of fourth-graders is performing at the level of the average fifth-, sixth- and seventh-grader. In each case, this is the percentage of the red fourth-grade distribution that is to the right of the mean of the distribution in a particular subsequent grade. I’ve highlighted the shaded area which represents the portion of the fourth-grade distribution that is scoring higher than the average seventh-grader. What percentage of fourth-graders falls into this area? 21%. Based on this way of thinking about test score gains across grades, one in five Delaware fourth-graders in 2001 were performing three years above grade level.
I find this percentage unreasonably high, but it follows from applying the same logic that is used by the authors of the DC Opportunity Scholarship Program evaluation, the Wall Street Journal, and many others. Anyone prepared to rely on this way of representing program impacts needs to acknowledge that it can lead to some surprising, and perhaps outlandish, inferences, too.
About our First Person series:
First Person is where Chalkbeat features personal essays by educators, students, parents, and others trying to improve public education. Read our submission guidelines here.
